
.svg)

What’s in the Email Benchmark?
The Deployteq Email Benchmark 2026 includes billions of emails sent across the Netherlands and the United Kingdom. Here’s what you’ll get from this year’s benchmark:
- The most up-to-date overview of email marketing, helping you compare your performance to the industry average.
- Interactive elements to filter by sector, industry, or compare year over year.
- A foundation to measure your KPIs for open rate, click-through, and optimal send times.
So, what are you waiting for? Get access now!
Get access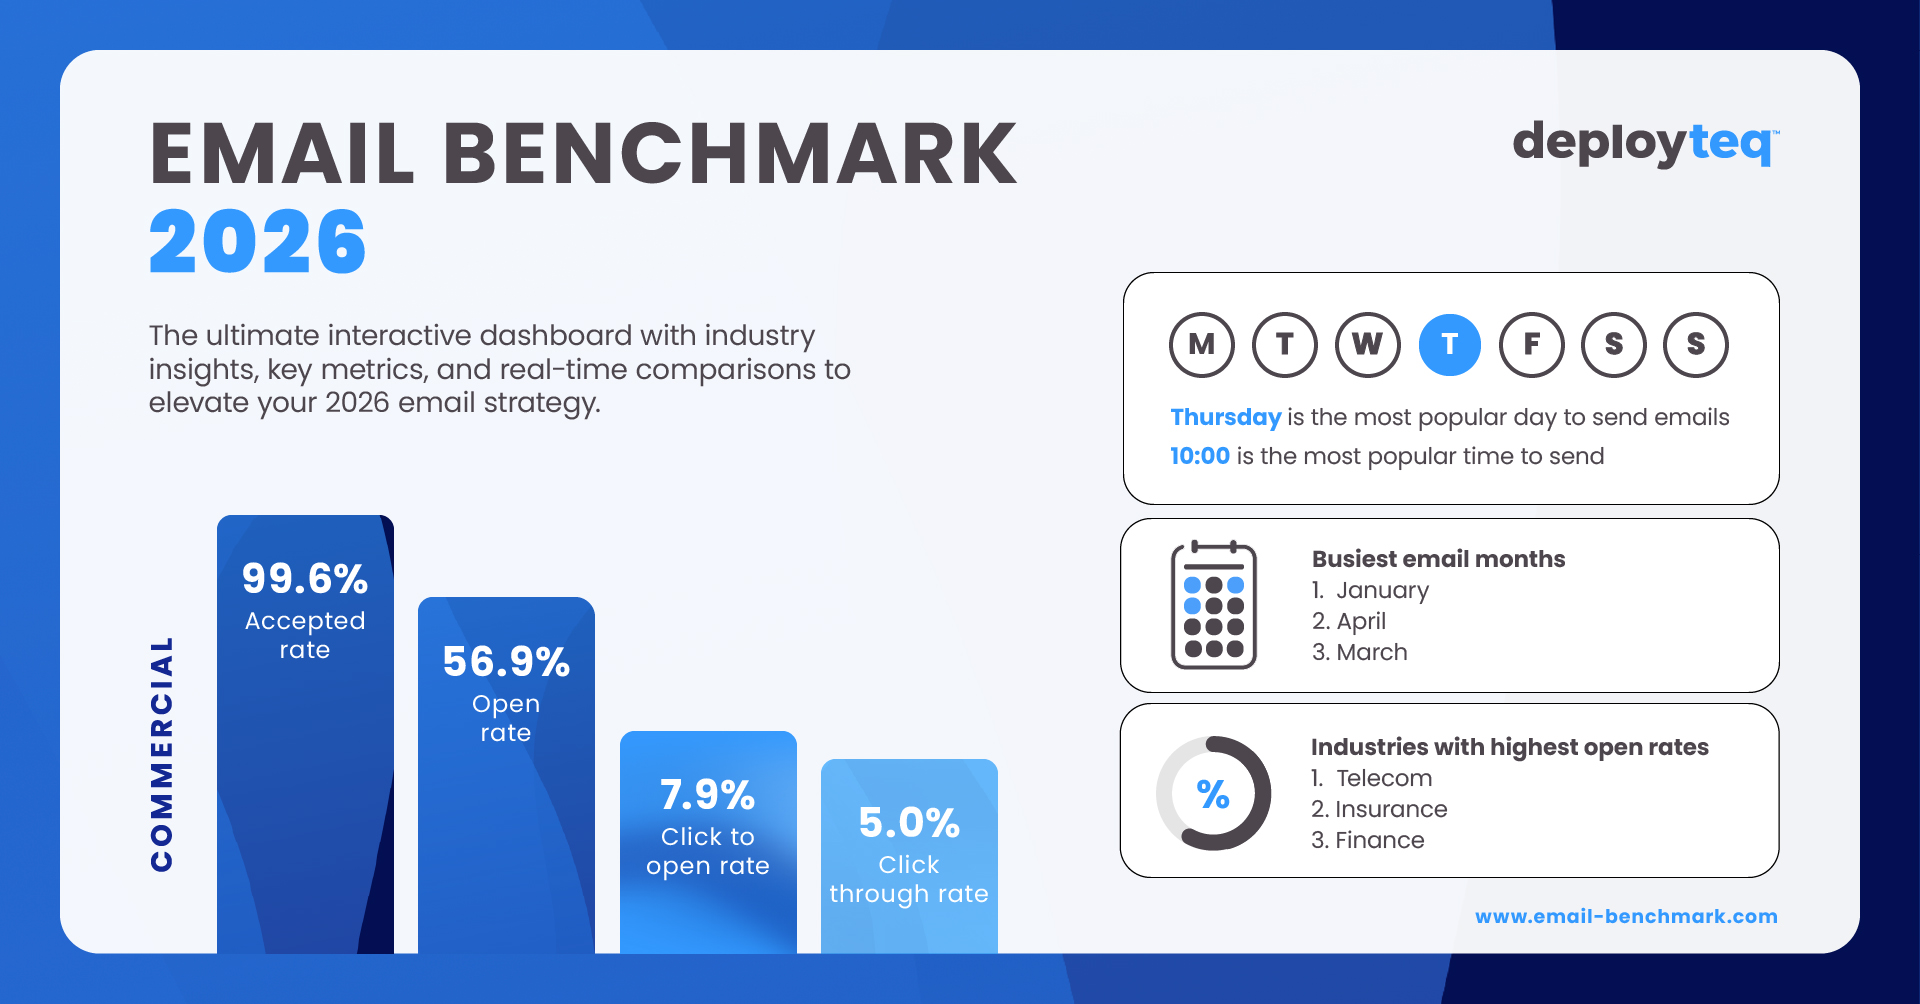
%20without%20background.png)


